Independent Salary Data Researcher
Published Jul 21, 2026
Maintained by the author using IRS Publication 15-T, SSA wage-base announcements, and BLS OEWS data.
All calculator formulas are deterministic JavaScript — no AI inference in the numbers.
Content is reviewed for accuracy when tax figures are updated annually. See Methodology · Author Profile
An $85,000 salary in San Francisco buys less than $65,000 in Austin. A $100,000 offer in
Tennessee goes further than the same offer in New York. Most salary comparisons stop at the offer
letter — this guide finishes the math so you know whether your number is actually enough for the
life you want to live.
100
US national cost-of-living index baseline (BEA Regional Price Parity, 2026)
Source: Bureau of Economic Analysis Regional Price Parities, 2026
Compare real purchasing power across states. Use the take-home pay calculator to see how your salary translates after taxes in different states, and the income percentile calculator for national context.
Estimates use 2026 federal tax brackets, representative state income tax rates, and BEA Regional Price Parities.
Individual situations — household size, employer benefits, commute, savings rate — move results materially.
See Methodology
New to cost-of-living comparisons? Start here:
Cost of living is the total amount needed to cover basics — housing, food, transport, healthcare, utilities — in a given location.
Purchasing power adjusts for how far a dollar goes locally. $80K in Mississippi buys more than $80K in California.
The estimator above gives you a personalized comparison in seconds. Keep reading for the full breakdown.
~40%Housing share of budget in California metros
0%State income tax in TX, FL, WA, NV, and 7 more
2.3×Mississippi buys 2.3× more than Manhattan per dollar
How the Numbers Work
Every comparison on this page uses three consistent layers so one dollar in one state is genuinely
comparable to one dollar in another.
Federal income tax. 2026 IRS single filer brackets, standard deduction $16,100.
Married Filing Jointly uses $32,200. Source:
irs.gov.
FICA payroll tax. 6.2% Social Security up to $184,500 plus 1.45% Medicare on all
wages. Additional 0.9% Medicare surtax above $200K. Source:
ssa.gov.
State income tax. 2026 top marginal rates, applied at the relevant income level.
Zero-rate states listed explicitly. Sources: individual state revenue department websites.
Cost of living index. Bureau of Economic Analysis Regional Price Parities (RPP) for
goods and services, with US average = 100. Below 100 means below-average cost; above 100 means above.
Source: bea.gov.
What this guide is. A state-level baseline for purchasing power and cost burden at
representative salary levels. What it is not. A personal financial plan, a rent-versus-buy
decision, or an accounting for employer health insurance, 401(k) match, or local property taxes.
Use the estimator above with your actual salary for a quick read, then the calculators below for precision.
The Five Cost Categories
Every cost-of-living index — BEA's included — is built from five major spending categories.
Here's how each one works and which states inflate or deflate them.
Housing (typically 28–42% of budget)
Housing is the single largest and most geographically variable cost. The national median rent for a
one-bedroom apartment ranges from under $900/month in parts of the Midwest and South to over
$2,400/month in coastal metros. Home ownership adds property tax — which explains why some
"no income tax" states recover that revenue through high property assessments. The rule of thumb:
housing is affordable if it costs less than 30% of gross income.
State income tax ranges from 0% in nine states to over 13% in California and New York for high earners.
But income tax is only part of the picture: Texas and New Hampshire fund government primarily through
property tax, which can add $4,000-$9,000/year for a median home. Tennessee and Louisiana hit
residents with high sales tax on everyday purchases.
Transportation costs vary most by whether you need a car. Cities with robust public transit — New York,
Chicago, San Francisco, Boston — let residents skip car ownership entirely, saving $8,000-$12,000/year.
Car-dependent suburbs and rural areas add fuel, insurance, maintenance, and depreciation. The average
American household spends $10,500/year on vehicles; the cost is highest in low-density metros and
lowest in walkable cities.
Healthcare (typically 7–12% of budget)
Healthcare premiums, out-of-pocket costs, and dental/vision vary significantly by employer plan and state.
Individual market premiums under the ACA also differ by state and income level. For broad comparisons,
this guide uses the BLS Consumer Expenditure Survey's average healthcare spending as the baseline.
See healthcare premium impact on take-home →
Food + Utilities + Other (typically 18–28% of budget)
Groceries, dining out, electricity, gas, internet, phone, and miscellaneous goods. This is the most
regionally stable category — the gap between the cheapest and most expensive state is narrower here
than in housing. The BEA's RPP data captures this consistency: price parities for groceries
cluster tightly around the national average compared to housing.
Living on $50,000 a Year
$50,000 gross for a single filer leaves roughly $38,500-$43,000 after federal and FICA taxes — before
state income tax. After average housing, transportation, and other essentials, a $50K salary is tight
in California, New York, and Massachusetts. It is workable in Texas, Florida, and the Midwest.
$50,000 gross — Single filer
California~69% of US avgTight. Housing eats 38-42% of gross. ROPS likely needed.
Texas~94% of US avgManageable. No state income tax. Car required in most metros.
Mississippi~85% of US avgMost affordable of all 50 states. Healthcare access may be limited.
New York (upstate)~91% of US avgOutside NYC metro, costs moderate. NYC itself pushes well above 120%.
At $50K, the question is not "which state" but "which city." A job in rural Minnesota or
Tennessee on $50K can feel richer than the same salary in Denver or Seattle.
Calculate your take-home at $50K →
Living on $100,000 a Year
$100,000 is the threshold where most financial advisors consider a household "comfortable." After
federal tax, FICA, and state tax, net income ranges from roughly $67,000 in California to $77,000 in
Texas. The gap narrows significantly once cost of living is factored in.
$100,000 gross — Single filer
California (LA/SD/SF)~69–115% RPPSF/NYC: tight at $100K for a household. LA/SD: workable. Use estimator above.
Texas (Austin/Dallas/HTX~91–98% RPPStrong purchasing power. Austin has risen faster than Dallas or Houston in recent years.
Colorado (Denver/Boulder)~104–112% RPPHousing is the challenge. $100K in Denver requires careful budgeting to save meaningfully.
Florida (Miami vs. Jacksonville)~93–113% RPPMiami absorbs much of the premium. No income tax helps. Use estimator for your metro.
The real test at $100K is savings rate. If housing, taxes, and cost of living leave 15%+ of gross as
discretionary or savings, the salary is working. If those categories absorb 85%+, the headline number
is misleading. Compare your salary to cost of living →
Best Purchasing Power States (2026)
Purchasing power ranks states by how far a dollar goes after cost of living. At the national average
income, these states stretch a salary furthest.
2Arkansas~87Low cost of goods + no major metro premium
3Alabama~88Low housing + low food costs
4West Virginia~89Low cost of housing + utilities
5Kansas~90Low COL outside Kansas City metro
6Oklahoma~90Low housing + low property taxes
7Missouri~91St. Louis area is affordable; KC premiums modest
8Iowa~91Low cost across all categories
9Tennessee~91No income tax + low housing outside Nashville
10Texas (rural metros)~93–96No income tax. Major metros have inflated housing.
These rankings use BEA Regional Price Parities. Rankings shift year-to-year as housing markets move.
A state that ranked 5th for purchasing power in 2022 may rank 8th in 2026 as migration patterns
and remote work inflate previously affordable metros.
Most Expensive States to Live (2026)
The most expensive states absorb a larger share of gross income for the same lifestyle baseline.
The gap between Mississippi and Manhattan can exceed $25,000/year in equivalent purchasing power.
RankState/MetroRPP IndexPrimary Driver
50Manhattan, NY~220+Housing: median rent $4,000+/mo
49San Francisco, CA~160Housing + high income taxes above $300K
46Massachusetts (Boston)~110–115Rent + high property taxes
45California (coastal metros)~105–130Housing the dominant factor
44Connecticut (Fairfield County)~108NYC bedroom community premium
43New Jersey (northern counties)~105–110NYC spillover + high property tax
The key insight: a $150,000 salary in San Francisco requires roughly $195,000 in
Austin to buy the same quality of life. The "higher salary" argument for expensive states only works if
your income significantly outpaces the cost premium — which is rare below $200K for most household types.
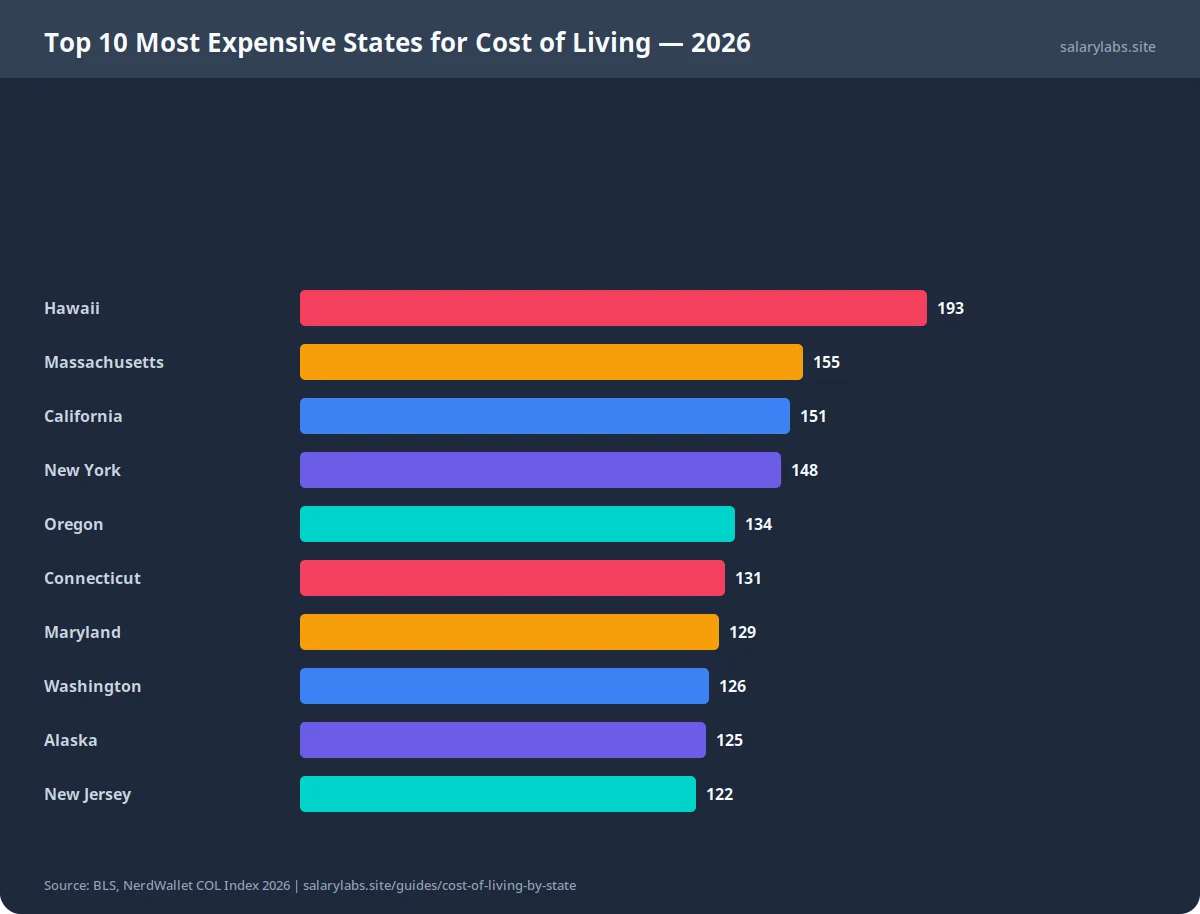
Top 10 Most Expensive States for Cost of Living — 2026 — salarylabs.siteView data table
Top 10 Most Expensive States for Cost of Living — 2026
Rank
Job / Category
Value
1
Hawaii
193
2
Massachusetts
155
3
California
151
4
New York
148
5
Oregon
134
6
Connecticut
131
7
Maryland
129
8
Washington
126
9
Alaska
125
10
New Jersey
122
What the Numbers Look Like for Real Workers
Abstract comparisons help. Specific workers help more. Here is what these state-level cost-of-living
differences mean for people in five common salary situations.
Software Engineer, $140K
In San Francisco: net ~$98K after taxes, real purchasing power ~$83K equivalent.
In Austin: net ~$106K after taxes, real purchasing power ~$104K equivalent.
The Austin $140K is worth more than the SF $140K at this income level. Remote workers
keeping SF salaries while living in Austin or Raleigh are in an unusually favorable position.
Software Engineer salary guide →
Registered Nurse, $78K
In Los Angeles: net ~$59K after taxes, real purchasing power ~$51K equivalent.
In Dallas: net ~$63K after taxes, real purchasing power ~$61K equivalent.
The Texas RN keeps more and buys more. Union nursing contracts in California add benefits
that narrow the gap for total compensation. RN salary guide →
Teacher, $62K
In New York City: net ~$48K after taxes, real purchasing power ~$42K equivalent.
In Nashville: net ~$51K after taxes, real purchasing power ~$50K equivalent.
Tennessee's below-average teacher pay is partially offset by its zero income tax and low cost of living.
Teacher salary guide →
Project Manager, $95K
In Chicago: net ~$71K after taxes, real purchasing power ~$70K equivalent.
In Miami: net ~$74K after taxes, real purchasing power ~$71K equivalent.
Chicago's lower housing cost vs. coastal cities makes $95K competitive even against
nominally higher offers elsewhere. PM salary guide →
Data Scientist, $120K
In Seattle: net ~$88K after taxes, real purchasing power ~$84K equivalent.
In Pittsburgh: net ~$91K after taxes, real purchasing power ~$89K equivalent.
Pittsburgh's lower cost of living makes $120K more competitive than Seattle's nominally higher
tech salaries. Data Scientist salary guide →
Salary Calculators to Finish the Math
Cost of living sets the context. Your take-home pay answers the specific question: how much
actually hits my account? Use these tools for the precision layer.
Not automatically. Low-cost states may offer fewer high-paying job opportunities, lower-quality
public schools, less cultural infrastructure, and higher healthcare deserts. The question is whether
the salary you can earn in a low-COL state covers your realistic lifestyle goals. For remote
workers with stable income, low-COL living is often a significant wealth-building advantage.
Does no state income tax mean more take-home pay?
Yes, all else equal. Texas, Florida, Washington, Nevada, and seven other states levy zero income
tax. For a $100K earner, this saves $3,000-$9,000/year compared to California or New York.
But those savings can be offset by higher property taxes, sales taxes, or higher housing costs.
The full picture requires the take-home calculation above, not just the income tax rate.
How much should I save if I live in an expensive state?
Financial planners commonly recommend 20% gross savings rate for long-term wealth building. In
expensive coastal markets, achieving this requires either a higher income or accepting a smaller
apartment. Many high-COL city residents use geographic arbitrage — earning city salaries while
investing aggressively — then relocating to a lower-COL area when ready for a home purchase.
Should I negotiate salary differently based on state cost of living?
Yes. A negotiation framed in real purchasing power is more persuasive than nominal dollars.
"My research shows $120K in Denver buys approximately what $145K buys in San Francisco" is a concrete
counter-offer framework. Use the Negotiation Script Generator to
build a data-backed negotiation script for your specific situation.
Does the 401(k) match change the state comparison?
It can. A 6% employer match on $100K is $6,000/year of free money. If the high-COL employer
offers a better 401(k) match, HSA contribution, or equity — factor that into total compensation
before deciding based on cost of living alone. See retirement contribution guide →
Data sourced from the Bureau of Economic Analysis Regional Price Parities, BLS Consumer Expenditure Survey,
IRS Publication 15-T, SSA wage-base announcements, and individual state revenue departments.
Cost-of-living indices reflect 2024 BEA data; 2026 updates will be incorporated when released.
All estimates are directional baselines, not individual financial advice.
See full methodology →